Analyzing ORCA card tap history for the Boop Report
If you haven’t already, and you’re in the Puget Sound, please check out the Boop Report to get some fun stats on your transit rides! If you’re not in the Puget Sound, maybe someone left a CSV Download sitting around somewhere so you can try it out…
A bit of ORCA card history
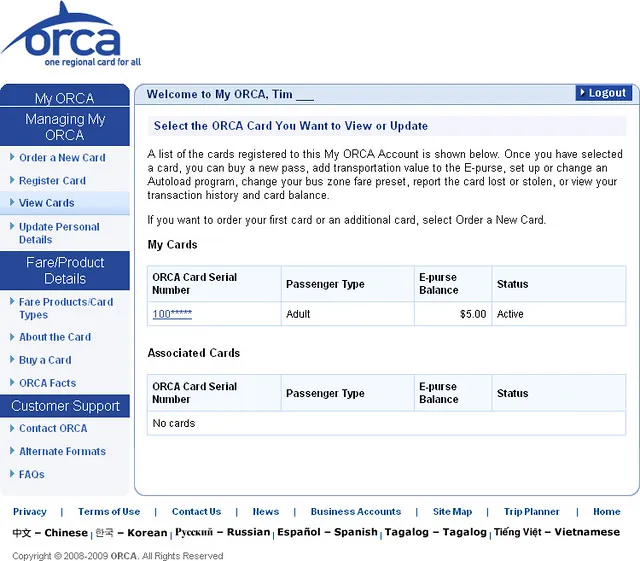
The Puget Sound’s common fare card, ORCA (one regional card for all), has been around since 2009, before the era of linking up every light bulb, toaster, and transit fare card reader to the internet.
By 2022, the system showed its age. Readers synchronized with the central computer only once daily (while buses were in the shop), causing up to a day’s delay for ride history updates and online reloads syncing to the card.
In the late 2010s, I experimented with web scraping and wrote a Python tool to parse the ORCA website’s trip history table into a CSV. Collaborating with Kona Farry (creator of Pantograph), we developed code to normalize this data: linking tap-on/tap-off events, fixing inconsistent route names, and generating stats based on fares and routes.
Unfortunately, packaging and deploying this scraper publicly proved challenging without potentially attracting unwanted attention from ORCA HQ as we would have had to collect plaintext usernames and passwords to run the scraper on someone’s account.
Thankfully, the ORCA 2.0 (or “NextGen”) system launched in October 2022, addressing many old ORCA frustrations. Thanks to what I assume is a juicy cellular service contract, readers now update trip history online almost instantly. But the most exciting feature for me was the tantalizing “Download CSV” button. No more scraping!
Normalizing the messy CSV data
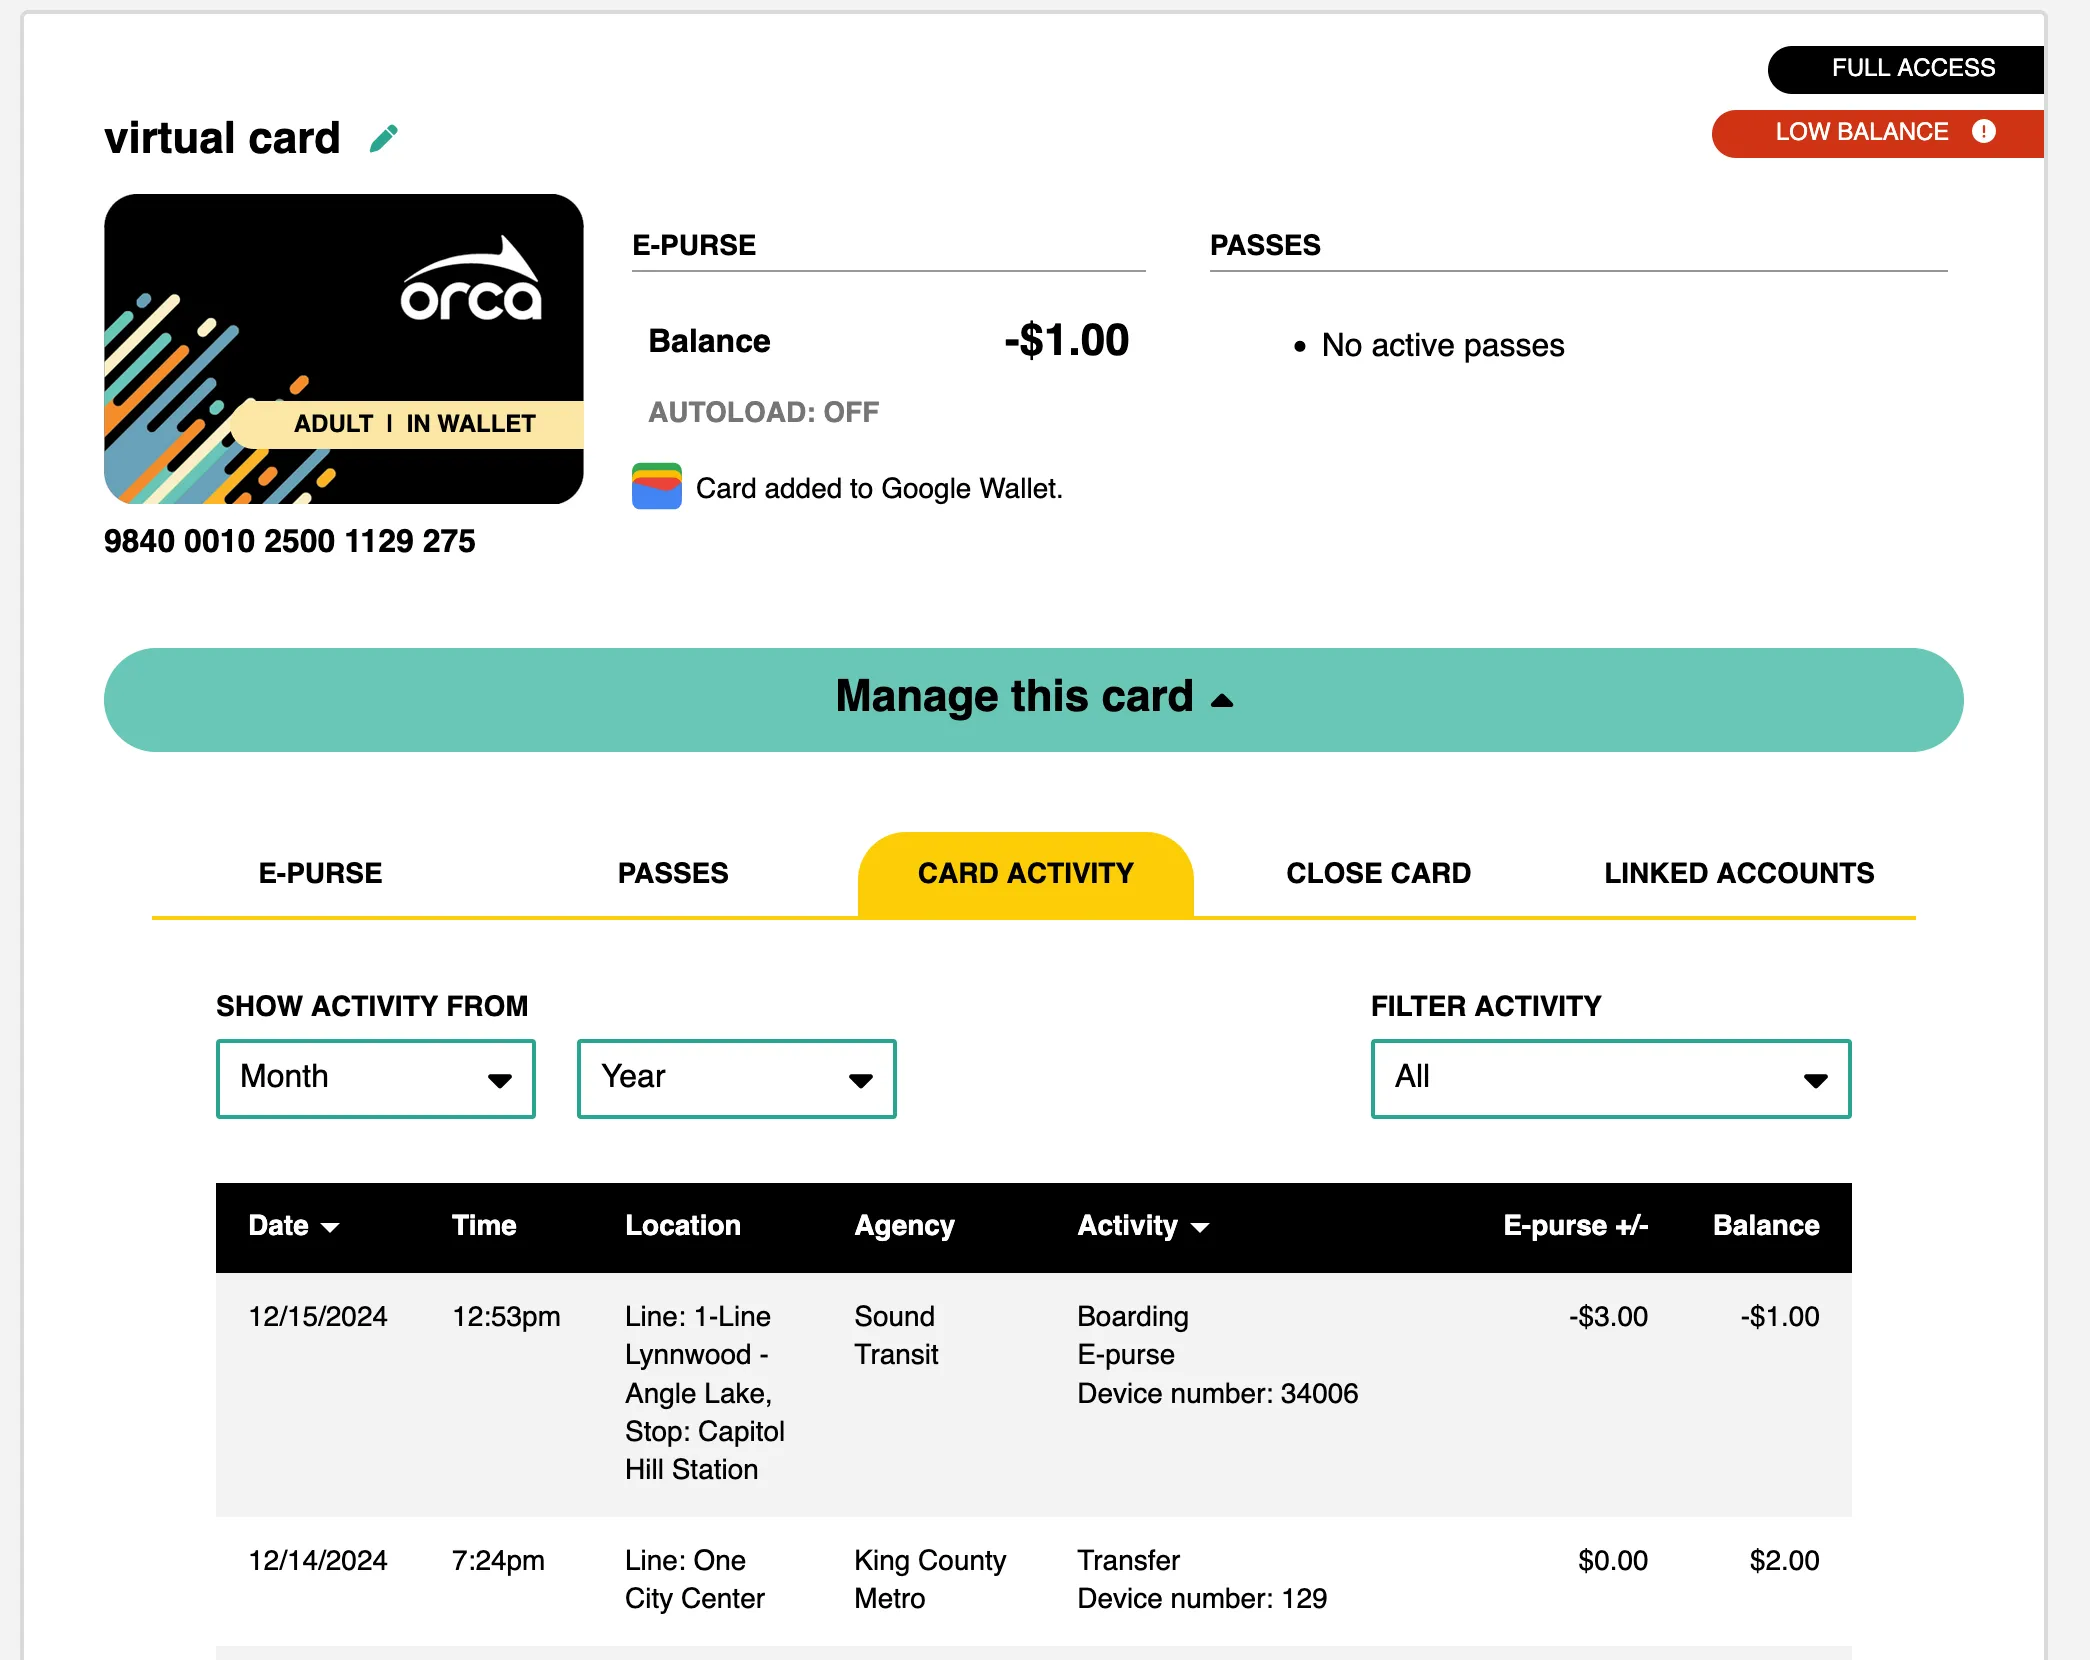
The ORCA CSV contains columns: Date, Time, Location, Agency, Activity, Amount, and New Balance. These columns pack a surprising amount of data, albeit not always perfectly formatted or consistent, but usable for parsing.
The Location column contains details like route and stop:
Line: 70 University District - Eastlake - Downtown Seattle, Stop: Virginia St & 9th Ave
From this, we can extract the line name/number and the stop name. It’s fascinating (or slightly creepy, depending on your perspective) that this level of detail is available!
The Activity column describes the transaction type. The example above might appear as Boarding, E-purse, Bus number: 7046. It’s also used for other event types, like online/mobile/vending machine transactions, tap offs, declined transactions, and fare inspections.
Through a series of regex patterns and somewhat messy conditional logic, each CSV row is transformed into an object containing: cost, balance, time, line (the full string after Line:), routeShortName (line number), agency, activity (an enum representing all identified activity types), and declined (boolean).
const lineStr = row.Location.match(/Line: ([^,]*)/)?.[1].trim();
const stopStr = row.Location.match(/Stop: (.*)/)?.[1].trim();
const routeNumberMatch = lineStr.match(/(Swift \w+)|(\w+[\s-]Line)|\d+/);
For ferries we generate short names based on a simple formula to shorten them down from the long names such as “Mukilteo - Clinton” becomes Cli-Muk Ferry.
function getWSFRoute(string: string): string | undefined {
	const abbreviated = string.match(/(\b)[A-HJ-Z]\w{0,2}/g)?.sort();
	const shortened = abbreviated?.join("-");
	return shortened ? `${shortened} Ferry` : undefined;
}
Inconsistent Data
The most frustrating data quality issue, which seemed intermittent, was routes losing their number, leaving only the name string in the Location data:
Line: University District - Eastlake - Downtown Seattle, Stop: Virginia St & 9th Ave
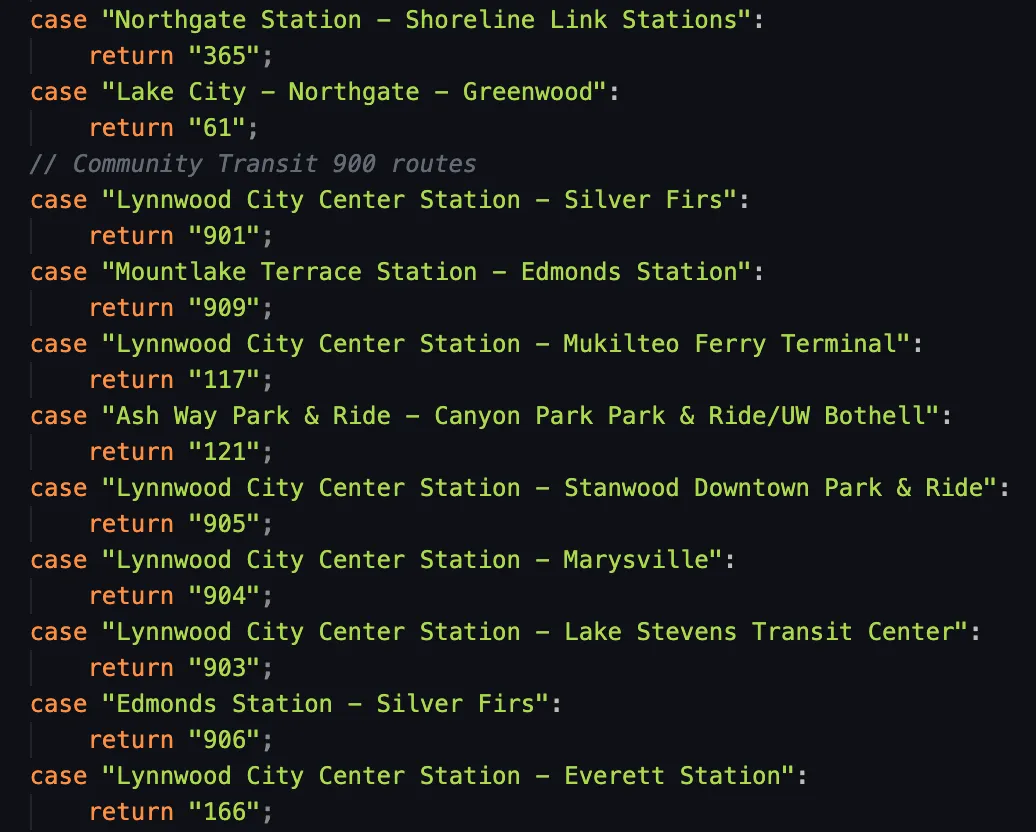
To handle this, our code uses a fallback lookup table when the route number regular expression finds no match. Initially, I hoped names would align with the GTFS routeLongName, but no luck! My solution for collecting all ORCA line names? A transit nerd’s dream: ride every route and log the data!
I couldn’t ride every affected route, so I decided to log missing data instances and inform the user. (This wasn’t fully implemented due to privacy considerations). Fortunately, the issue seems less common now; my latest CSV download had fewer missing route numbers. (hey Community Transit: still some room for improvement!)
Additionally, edge cases existed where one route name string could correspond to multiple numbers. Before the Lynnwood Link extension, Everett - Seattle could be route 510 or 512 (indistinguishable from the data), but post-service change, it’s only the 510. This also requires the lookup table logic to consider the date of the trip.
case "Everett - Seattle":
    if (!isBefore(time, AUG_2024_SERVICE_CHANGE_DATE)) {
        return "510";
    }
    return "510/512";
Converting CSV rows into a list of trips
Next, we process rows sequentially to match tap-on and tap-off events (and identify missed tap-offs! shame!!!). For trips with tap-offs, the system charges the maximum fare at tap-on and refunds the difference at tap-off. The goal is one “Orca Trip” object per journey.
Non-trip data (like fare enforcement records) is kept separate and tallied independently.
Generating stats (and support for combining data from multiple cards)
Finally, we aggregate data from the processed Orca Trips and other records to calculate statistics, such as usage counts for each route, station, stop, and bus.
True transit fans possess multiple cards, so naturally, the tool supports consolidating data from several CSVs. It’s crucial to process each CSV separately to avoid confusion with overlapping tap-on/tap-off events between cards. Processing happens per card, and then the resulting stats are combined.

This graphic shows an example of why it’s important to process each card independently. A situation like this could arise if, for example, you travel with a family member and loan them your other ORCA card.

Persistence
I wanted to presist the user’s data so when they reopen the page, they wouldn’t have to reupload their CSV files. It could get quite annoying to do that on a mobile device, especially. However, since I took a completely server-free approach to this project, Boop Report stores the CSV data in the browser’s local storage.
The raw CSV data is stored, rather than any post processed data, so that any changes to the processing logic can be seen by just reloading without having to reupload. That means that on every page load, all the data is reprocessed from local storage. It’s quick enough to not have any real performance downsides.
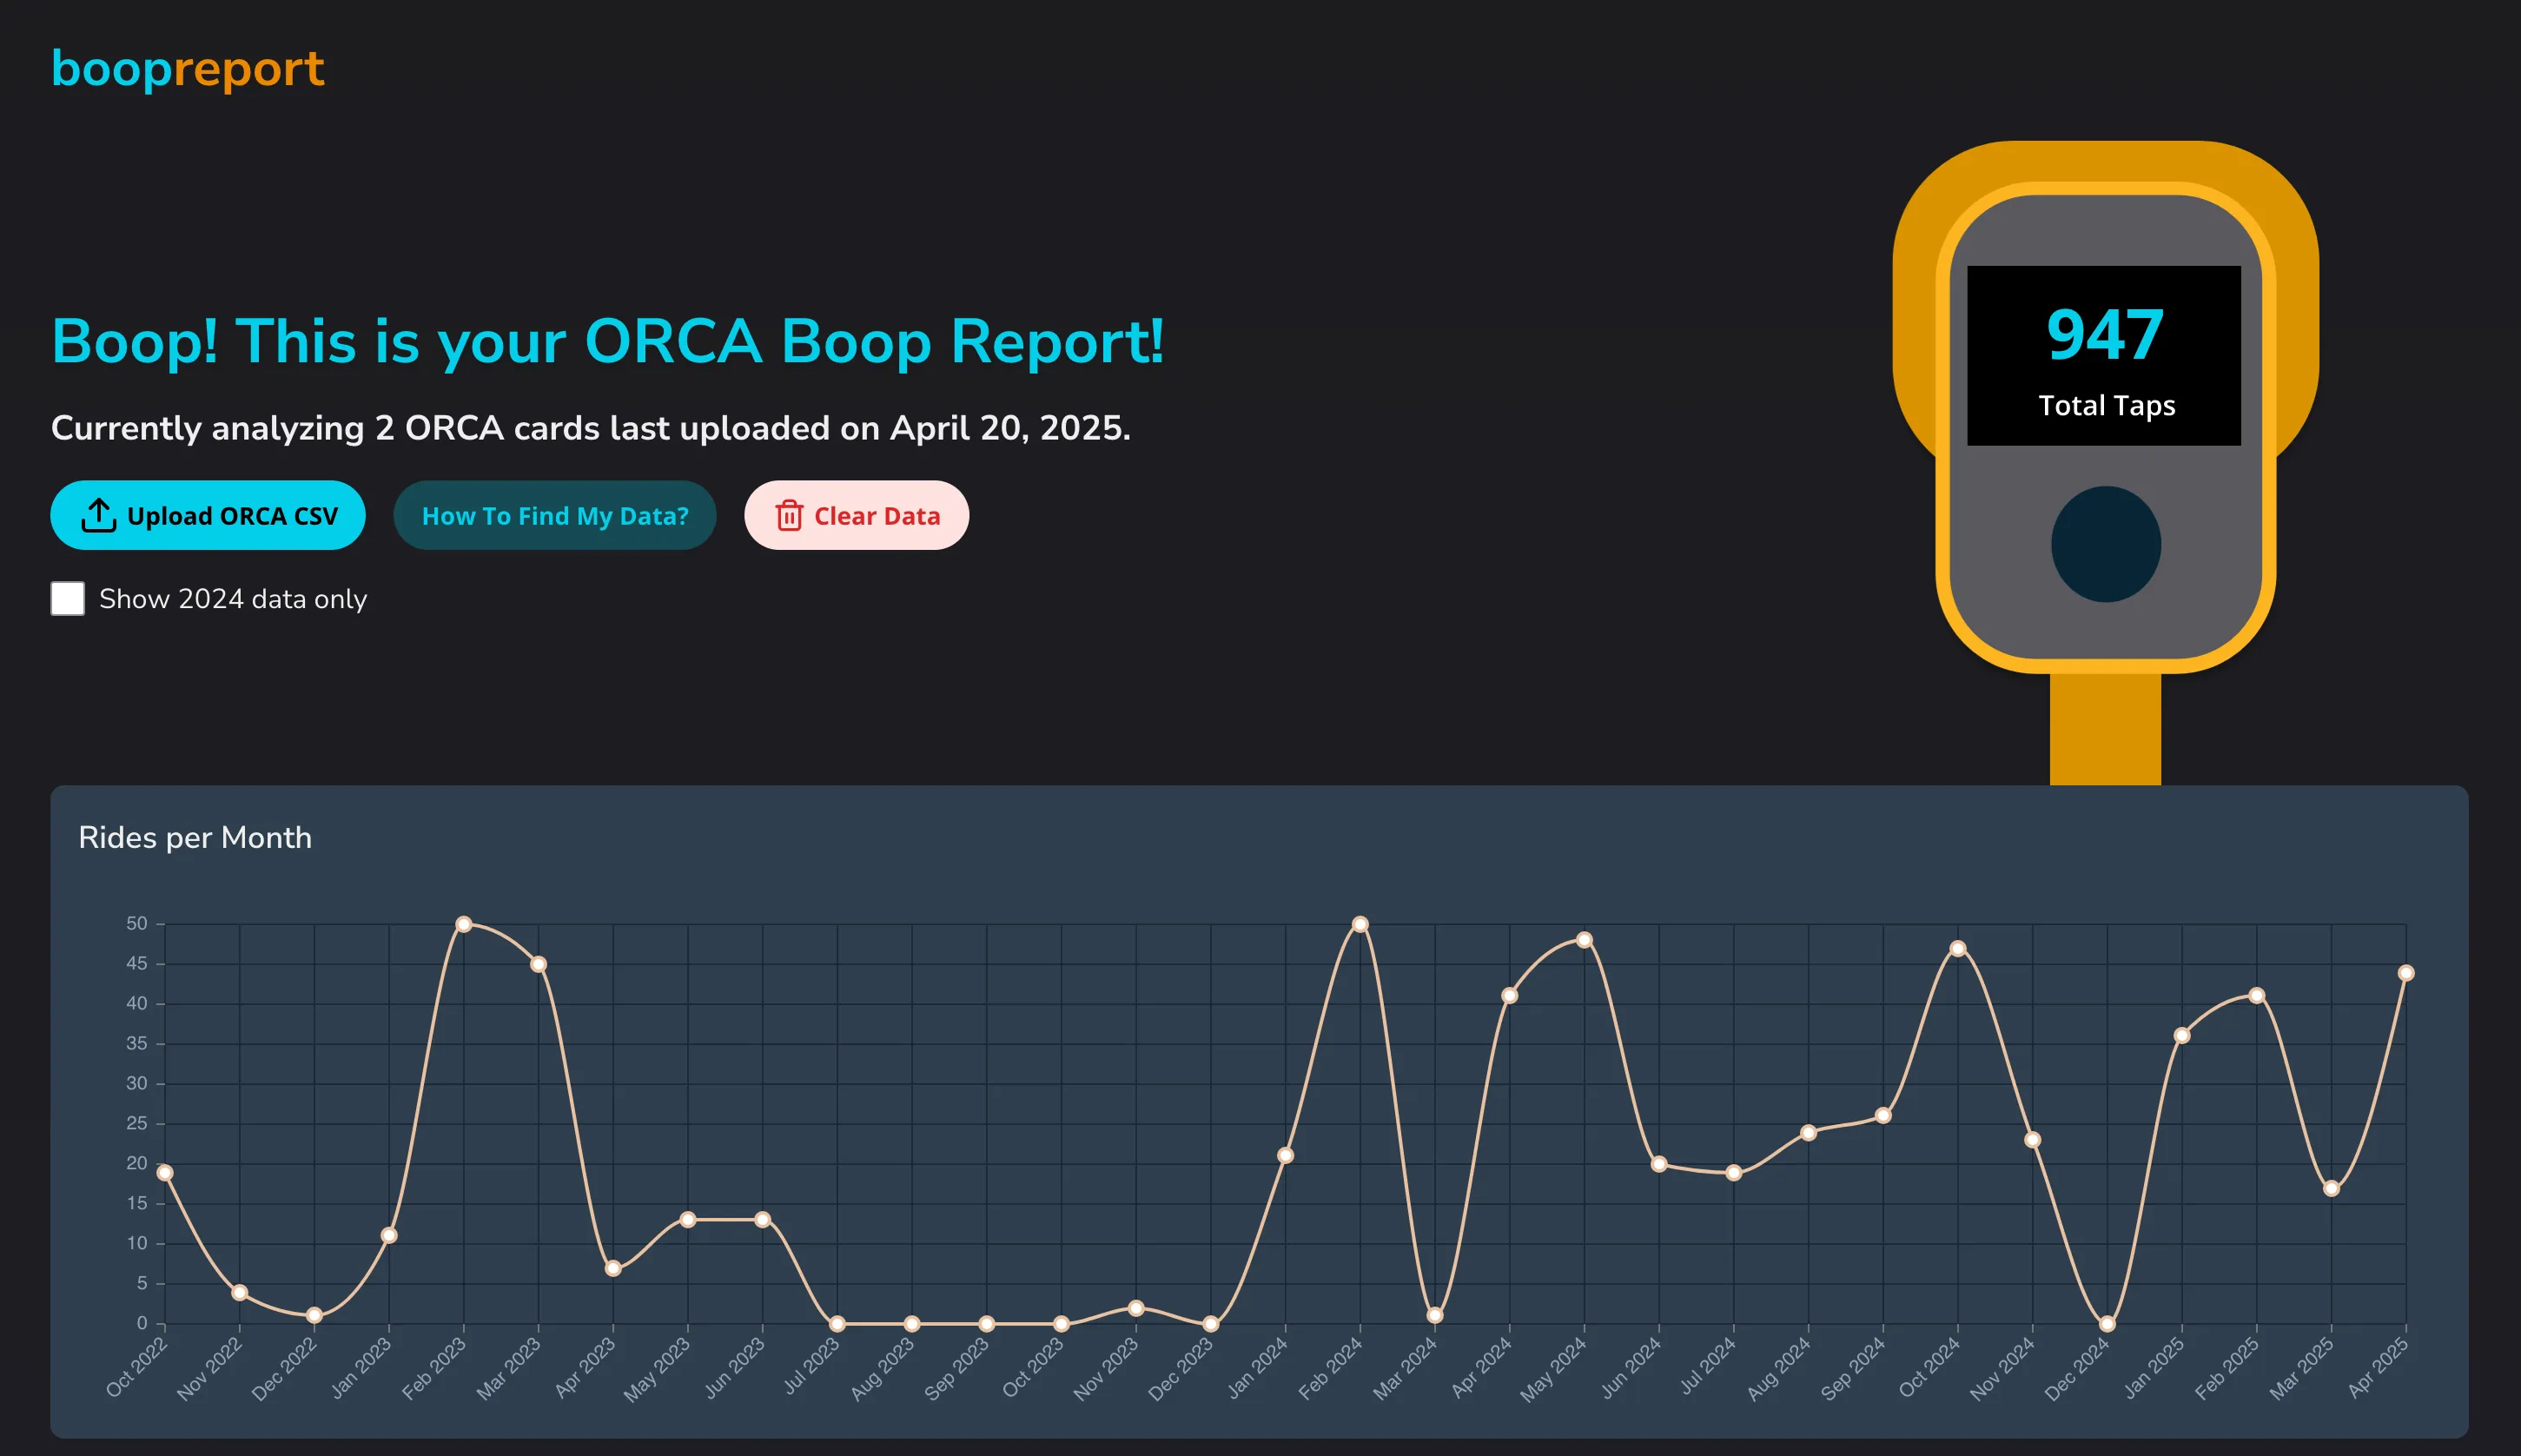
Data Viz
Transforming messy data into clean, interpretable objects is my forte; crafting an attractive UI to display it… less so. Thankfully, my friend Christiana Tebbs helped me out by drawing up some mockups in Figma and helping to implement them in React components.